Food-Stamp Use Climbs to Record, Reviving Campaign Issue
By Alan Bjerga - Sep 4, 2012 2:24 PM ET
Food-stamp use reached a record 46.7 million people in June, the government said, as Democrats prepare to nominate President Barack Obama for a second term with the economy as a chief issue in the campaign.
Participation was up 0.4 percent from May and 3.3 percent higher than a year earlier and has remained greater than 46 million all year as the unemployment rate stayed higher than 8 percent. New jobless numbers will be released Sept. 7.
“Too many middle-class families who have fallen on hard times are still struggling,” Agriculture Secretary Tom Vilsack said in an e-mailed statement today. “Our goal is to get these families the temporary assistance they need so they are able to get through these tough times and back on their feet as soon as possible.”
Food-stamp spending, which more than doubled in four years to a record $75.7 billion in the fiscal year ended Sept. 30, 2011, is the U.S. Department of Agriculture’s biggest annual expense. Republicans in Congress have criticized the cost of the program, and the House budget plan approved in April sponsored by Representative Paul Ryan of Wisconsin, the party’s vice- presidential nominee, would cut expenses by $33 billion over 10 years.
Cuts Planned
“We need a new direction,” Amanda Henneberg, a spokeswoman for Republican presidential nominee Mitt Romney, said in an e-mail. “Democrats are desperately trying to convince voters that they are better off than they were four years ago. But the opposite is true,” as evidenced by the food- stamp numbers, she said.
Reductions to the program have also emerged as a point of contention in debate over a farm bill to replace current law that expires Sept. 30. The U.S. Senate in June passed a plan that would lower expenditures by $4 billion over 10 years, while the House Agriculture Committee the following month backed a $16 billion cut.
During the Republican primary campaign, then-candidate Newt Gingrich labeled Obama as “the best food-stamp president in American history.” When the National Association for the Advancement of Colored People called his statements “inaccurate” and “divisive,” Gingrich dismissed the complaints as a smear from “modern liberals” who are “off the deep end.”
Food-stamp enrollment is rising partly because the USDA is pushing higher participation too aggressively, giving government money to people who may not need or want it, U.S. Senator Jeff Sessions said in a telephone interview.
‘Government Incompetence’
“This administration has been hawking food stamps,” said the Alabama Republican, who has called for lower spending on the program. “Every additional dollar in this program is borrowed money,” he said. “It’s one more example of government incompetence.”
Today’s report shows the two most populous states, California and Texas, had the most recipients. California was tops with 4.012 million, a 0.8 percent gain from the previous month and 7.3 percent more than the previous year. Texas was in second place, while down 0.4 percent from the previous month and 1.4 percent lower than a year earlier.
Louisiana and North Carolina, where Democrats are meeting this week to nominate Obama, had the biggest monthly gains in enrollment, 1.3 percent. Enrollment fell the most in Utah, down 1.4 percent from May, followed by Idaho and Ohio.
Spending on what’s officially called the Supplemental Nutrition Assistance Program totaled $6.21 billion in June, 0.4 percent higher than the previous month and 2.8 percent more than a year earlier. The record is $6.26 billion spent in September 2011.
About 47 percent of recipients are children, and 8 percent are elderly, according to the USDA. About half of all new recipients leave the program within 10 months.
http://www.bloomberg.com/news/2012-09-0 ... -says.html
Food-Stamp Use Climbs to Record 46.7 MILLION...
Moderator: Metal Sludge
-
brotherplanet

- Show Me Your Dick
- Posts: 7556
- Joined: Mon Feb 13, 2012 5:31 pm
-
DEATH ROW JOE

- Signed to a Major Label Multi-Album Deal
- Posts: 20480
- Joined: Sat Sep 19, 2009 11:51 pm
Re: Food-Stamp Use Climbs to Record 46.7 MILLION...
Things have dramatically improved from 4 years ago. It's idiotic to pretend they have not. Economy expanding is an improvement over an economy crashing.brotherplanet wrote:“Democrats are desperately trying to convince voters that they are better off than they were four years ago. But the opposite is true,” as evidenced by the food- stamp numbers, she said.
The food stamp rolls exploded 4 years ago. 13% increase from the start of the fiscal year in Oct 2008 to June 2009. Since the start of the fiscal year in Oct 2011, food stamp rolls have grown a mere .93%. So there is no question that things have dramatically improved.
SUPPLEMENTAL NUTRITION ASSISTANCE PROGRAM Monthly Data
http://www.fns.usda.gov/pd/34SNAPmonthly.htm
Oct 2008: 30,841,790
June 2009: 34,882,031
Oct 2011: 46,236,164
June 2012: 46,670,373
Private sector employment:
http://data.bls.gov/timeseries/CES0500000001
Oct 2008: 113279
June 2009: 107933 == 5.3 million jobs lost
Oct 2011:109781
June 2012:111317 == 1.5 million jobs created
1.5 million jobs created is better than 5.3 million jobs lost.
.93% growth in food stamp rolls is better than 13% growth in food stamp rolls.
-
brotherplanet
- Show Me Your Dick
- Posts: 7556
- Joined: Mon Feb 13, 2012 5:31 pm
Re: Food-Stamp Use Climbs to Record 46.7 MILLION...
Well, if by improved you mean more people are on food stamps then yes, I guess things have improved.
-
DEATH ROW JOE
- Signed to a Major Label Multi-Album Deal
- Posts: 20480
- Joined: Sat Sep 19, 2009 11:51 pm
Re: Food-Stamp Use Climbs to Record 46.7 MILLION...
Why are you so stupid? The food stamp rolls are barely growing now. 4 years ago they were exploding. That's an improvement. Learn to distinguish between damage caused by Bush's recession and the current state of the economy.brotherplanet wrote:Well, if by improved you mean more people are on food stamps then yes, I guess things have improved.
Read again shit for brains:
1.5 million jobs created is better than 5.3 million jobs lost.
.93% growth in food stamp rolls is better than 13% growth in food stamp rolls.
Claiming the nation is worse off today is as absurd as claiming the "fundamentals of the economy are sound" back in 2008. It's the same idiots. They are wrong then and they are wrong now.

-
Drunk Kennedy

- MSX Tour Support Act
- Posts: 4191
- Joined: Wed Mar 29, 2006 7:11 am
Re: Food-Stamp Use Climbs to Record 46.7 MILLION...
DEATH ROW JOE wrote:

-
brotherplanet
- Show Me Your Dick
- Posts: 7556
- Joined: Mon Feb 13, 2012 5:31 pm
Re: Food-Stamp Use Climbs to Record 46.7 MILLION...
DEATH ROW JOE wrote:I'm going to ignore this headline...
Food-Stamp Use Climbs to Record, Reviving Campaign Issue
And anything else that doesn't point to what I want people to believe such as this... Participation was up 0.4 percent from May and 3.3 percent higher than a year earlier and has remained greater than 46 million all year as the unemployment rate stayed higher than 8 percent. New jobless numbers will be released Sept. 7!
-
DEATH ROW JOE
- Signed to a Major Label Multi-Album Deal
- Posts: 20480
- Joined: Sat Sep 19, 2009 11:51 pm
Re: Food-Stamp Use Climbs to Record 46.7 MILLION...
Nothing was ignored shit for brains. The word "record" merely means the food stamp rolls continue to grow. Food stamp rolls could grow by 1 person in a year and you would have a "record." In this context, the word "record" is merely used to sensationalize the story. It does not tell you whether the situation is better or worse. If you want to actually look at whether the situation is improving, you have to look at the growth rates.brotherplanet wrote:DEATH ROW JOE wrote:I'm going to ignore this headline...
Food-Stamp Use Climbs to Record, Reviving Campaign Issue
And anything else that doesn't point to what I want people to believe such as this... Participation was up 0.4 percent from May and 3.3 percent higher than a year earlier and has remained greater than 46 million all year as the unemployment rate stayed higher than 8 percent. New jobless numbers will be released Sept. 7!
Annual rates of growth show the economy has improved.
June 2011: 45,183,927
June 2012: 46,670,373 = 3.3% growth in food stamp rolls
Oct 2008:30,841,790
Oct 2009: 37,672,818 = 22.1% growth in food stamp rolls.
3.3% annual growth in food stamp rolls is an improvement over 22.1% annual growth in the food stamp rolls.
Let's explain again to you two imbeciles what has caused the food stamp rolls to rise for 5 years. The Bush recession wiped out every job added to the private sector after Oct 1998. There were more employed in the private sector in Nov 1998 than in Jan 2010. So you have 11+ year of population growth and no private sector job growth. 4.5 million jobs have been added to the private sector since Jan 2010 which is why the rate of growth in the food stamp rolls has slowed dramatically. You two stupid assholes are confusing damage caused by Bush's recession with the current economic situation.
The economy is far stronger than it was 4 years ago when the GOP was claiming "the fundamentals of the economy are sound." So the country is better off than it was 4 years ago when the economy was in the process of shedding 9+ million private sector jobs. If you don't' agree, then you are most likely one of the dumb asses who thought the fundamentals of the economy were sound back in summer 2008.

-
DEATH ROW JOE
- Signed to a Major Label Multi-Album Deal
- Posts: 20480
- Joined: Sat Sep 19, 2009 11:51 pm
Re: Food-Stamp Use Climbs to Record 46.7 MILLION...
"Are Americans Better Off Today Than They Were Four Years Ago?" The Question That Exposes Incompetent Reporters
Sunday, 02 September 2012 21:44
http://www.cepr.net/index.php/blogs/bea ... -reporters
While the source is not clear, someone developed a simple way to identify incompetent news reporters. If you hear a reporter ask people in President Obama's administration, ideally in a belligerent tone, "are the American people better off than they were four years ago?,"the reporter is trying to tell you that they are not qualified to do their job.
The reason we know that the questioners are incompetent reporters is that this is a pointless question. Suppose your house is on fire and the firefighters race to the scene. They set up their hoses and start spraying water on the blaze as quickly as possible. After the fire is put out, the courageous news reporter on the scene asks the chief firefighter, "is the house in better shape than when you got here?"
Yes, that would be a really ridiculous question. Hence George Stephanopoulos was being absurd when he posed this question to David Plouffe, a top political adviser to President Obama on ABC's This Week. Bob Schieffer was being equally silly when he asked Martin O’Malley, the Chairman of the Democratic Governors Association, the same question on CBS's Face the Nation.
A serious reporter asks the fire chief if he had brought a large enough crew, if they had enough hoses, if the water pressure was sufficient. That might require some minimal knowledge of how to put out fires.
Similarly, serious reporters would ask whether the stimulus was large enough, was it well-designed, and were there other measures that could have been taken like promoting shorter workweeks, as Germany has done. That would of course require some knowledge of economics, but it sure makes more sense than asking if a house is better off after it was nearly burnt to the ground.
-
DEATH ROW JOE
- Signed to a Major Label Multi-Album Deal
- Posts: 20480
- Joined: Sat Sep 19, 2009 11:51 pm
Re: Food-Stamp Use Climbs to Record 46.7 MILLION...
Clean the shit out of your ears and read this asswipe:Drunk Kennedy wrote:
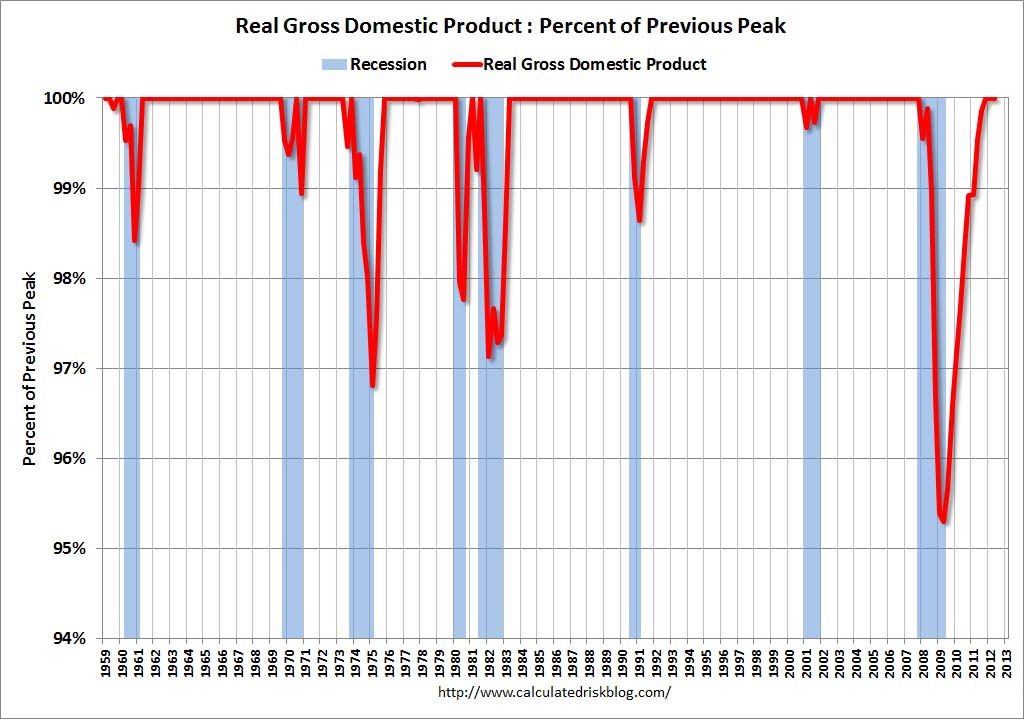
"All of these indicators collapsed in 2008 and early 2009, and only real GDP is back to the pre-recession peak. At the current pace of improvement, industrial production will be back to the pre-recession peak in early 2013, personal income less transfer payments late in 2013, and employment in late 2014."
Recovery Measures
by Bill McBride on 8/05/2012 09:40:00 AM
http://www.calculatedriskblog.com/2012/ ... sures.html
Here is an update to four key indicators used by the NBER for business cycle dating: GDP, Employment, Industrial production and real personal income less transfer payments.
Note: The following graphs are all constructed as a percent of the peak in each indicator. This shows when the indicator has bottomed - and when the indicator has returned to the level of the previous peak. If the indicator is at a new peak, the value is 100%.
These graphs show that several major indicators are still significantly below the pre-recession peaks.
This graph is for real GDP through Q2 2012.
Real GDP returned to the pre-recession peak in Q4 2011, and has been at new post-recession highs for three consecutive quarters.
At the worst point - in Q2 2009 - real GDP was off 4.7% from the 2007 peak.
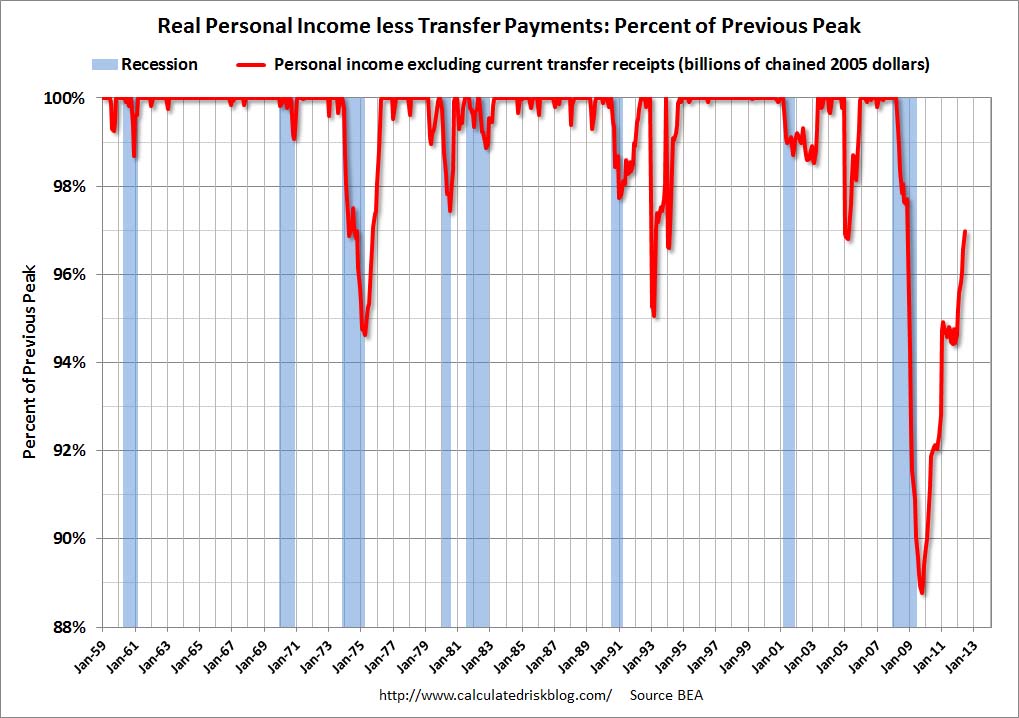
Personal Income less TransferReal GDP has performed better than other indicators ...
=============
This graph shows real personal income less transfer payments as a percent of the previous peak through the June report.
This measure was off 11.2% at the trough in October 2009.
Real personal income less transfer payments are still 3.0% below the previous peak.
=============
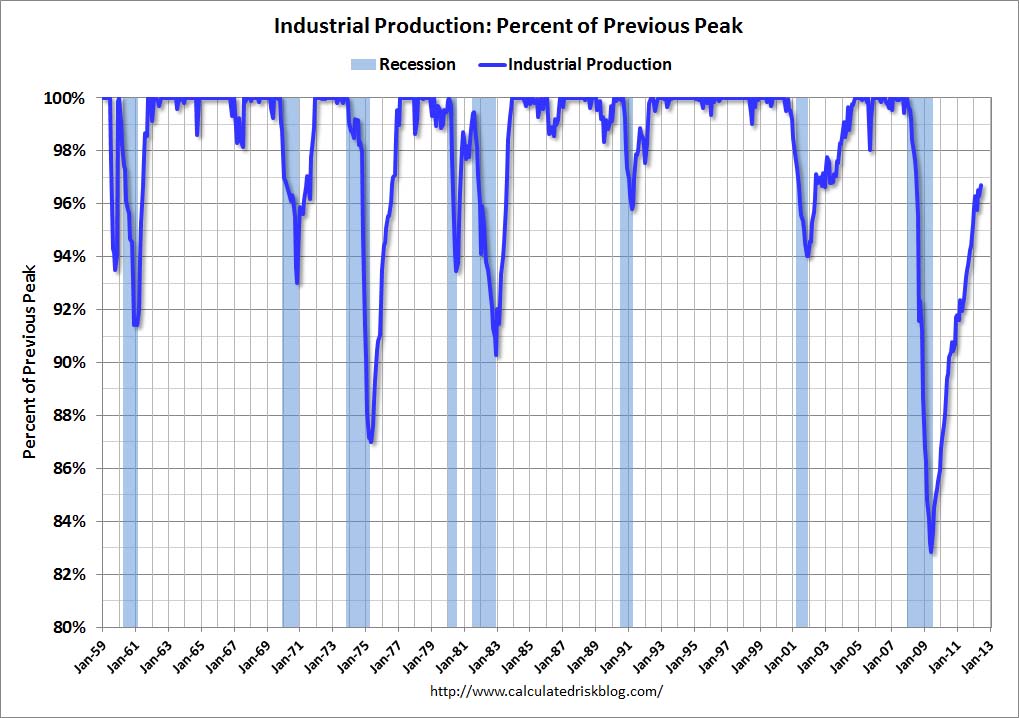
The third graph is for industrial production through June.
Industrial production was off over 17% at the trough in June 2009, and has been one of the stronger performing sectors during the recovery.
However industrial production is still 3.3% below the pre-recession peak.
=============
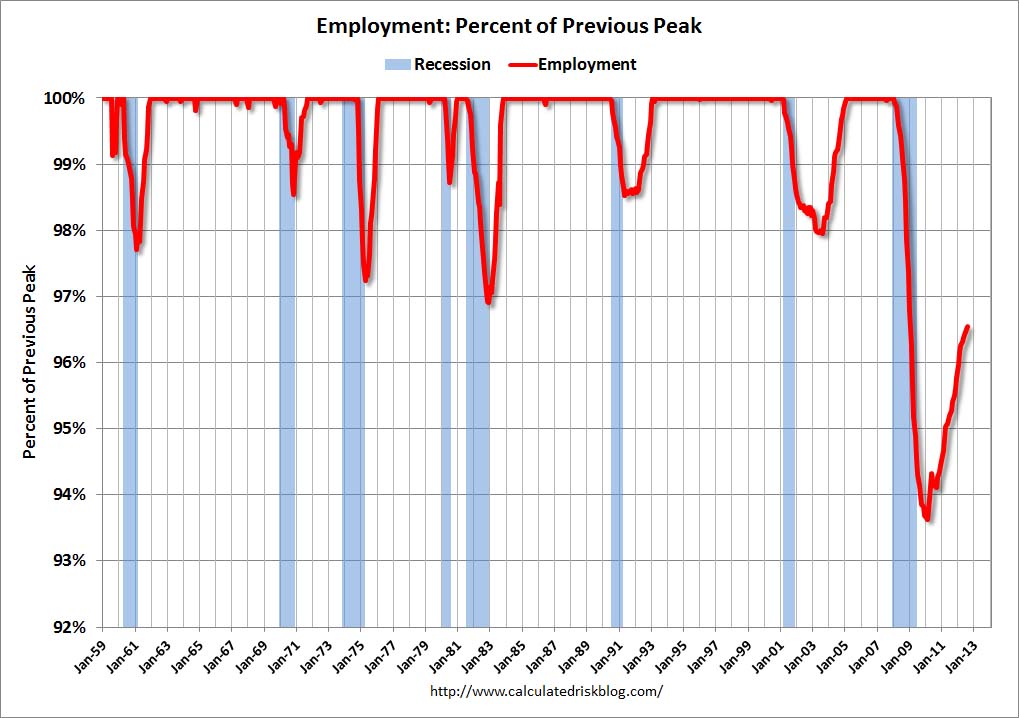
The final graph is for employment. This is similar to the graph I post every month comparing percent payroll jobs lost in several recessions.
Payroll employment is still 3.5% below the pre-recession peak.
All of these indicators collapsed in 2008 and early 2009, and only real GDP is back to the pre-recession peak. At the current pace of improvement, industrial production will be back to the pre-recession peak in early 2013, personal income less transfer payments late in 2013, and employment in late 2014.
-
DEATH ROW JOE
- Signed to a Major Label Multi-Album Deal
- Posts: 20480
- Joined: Sat Sep 19, 2009 11:51 pm
Re: Food-Stamp Use Climbs to Record 46.7 MILLION...
Here is further proof that the economy can improve while the food stamp rolls grow. This uses your favorite alternative measure of unemployment, U6.brotherplanet wrote:DEATH ROW JOE wrote:I'm going to ignore this headline...
Food-Stamp Use Climbs to Record, Reviving Campaign Issue
And anything else that doesn't point to what I want people to believe such as this... Participation was up 0.4 percent from May and 3.3 percent higher than a year earlier and has remained greater than 46 million all year as the unemployment rate stayed higher than 8 percent. New jobless numbers will be released Sept. 7!
U6, what you refer to as "the real unemployment rate", fell from 16.7% in Jan 2010 to 15% in July 2012. Meanwhile the food stamp rolls grew by 18%.
From Jan 2010 to July 2012, the "real" number of people "unemployed" fell by 2.55 million while the food stamp rolls increased by 2.43 million.
From Jan 2010 to July 2012, the "real" number of people "unemployed" fell by 10% while the food stamp rolls increased by 18%.
U6 rate
http://data.bls.gov/timeseries/LNS13327709
Labor force:
http://data.bls.gov/timeseries/LNS11000000
U6 rate x labor force = "real unemployed"
Food stamp monthly data:
http://www.fns.usda.gov/pd/34SNAPmonthly.htm
Jan 2010: Total unemployed, plus all marginally attached workers plus total employed part time for economic reasons, as a percent of all civilian labor force plus all marginally attached worker = 16.7% x 154236 = 25,757,412
Food stamp rolls Jan 2010: 44,187,874
Jan 2012: Total unemployed, plus all marginally attached workers plus total employed part time for economic reasons, as a percent of all civilian labor force plus all marginally attached worker = 15% x 155013 = 23,251,950
Food stamp rolls Jan 2012: 46,670,373
"real" unemployed fell by 2.55 million while the food stamp rolls increased by 2.43 million. Increase in the food stamp rolls does not mean the economy has gotten worse.

-
brotherplanet
- Show Me Your Dick
- Posts: 7556
- Joined: Mon Feb 13, 2012 5:31 pm
Re: Food-Stamp Use Climbs to Record 46.7 MILLION...
Post all the graphs you want. Food stamp usage is at a record high. You're in denial because much like a Scientologist you don't
want to see how fucked up your leaders are.
want to see how fucked up your leaders are.
-
DEATH ROW JOE
- Signed to a Major Label Multi-Album Deal
- Posts: 20480
- Joined: Sat Sep 19, 2009 11:51 pm
Re: Food-Stamp Use Climbs to Record 46.7 MILLION...
LMFAO, you fucking moron. I said many many times Bush's failed economic policies are the reason the food stamp rolls keep growing. So I did say the "leader" was fucked up.brotherplanet wrote:Post all the graphs you want. Food stamp usage is at a record high. You're in denial because much like a Scientologist you don't
want to see how fucked up your leaders are.
I've also said many times that Obama made mistakes:
1) should have provided enough aid to state and local govt to keep public sector employment rising at the same rate as it did under Bush. That alone would have reduced unemployment rate to about 7%
2) should have written down mortgages
3) should have used political capital for job bills rather than health care reform and Dodd/Frank
If he had done the above 3, then unemployment rate would be about 6.5%.
I've also criticized Clinton's economic policies:
1) exploited the Asian financial crisis in 1997 to pursue a strong dollar policy. That decision caused the manufacturing sector to shed jobs from 1998 to 2010.
2) cut the capital gains tax from 28% to 20% which subsidized the dot com bubble and made it more damaging.
So there is no problem criticizing "leaders."
Back to food stamps, there is excess supply of labor keeping wages flat meanwhile food prices grow at a modest rate of 2%/year. Add in population growth and you have food stamp rolls slowly growing and "setting records." There is an excess supply of labor because the Bush recession wiped out all the jobs added to the private sector after Nov 1998. All explained above. So the leader was clearly blamed.
You are claiming that the economy is worse than it was 4 years ago because food stamps are at a record high.
Now I've shown you 3 different ways that the economy is better off than it was 4 years ago.
1) private job growth = private sector employment was crashing 4 years ago and it's now expanding.
2) the measures of recovery = 4 different economic indicators showing the economy is recovering. By one measure, real GDP, it has already recovered.
3) the U6 rate fell from 16.7% in Jan 2010 to 15% in July 2012 while the food stamp rolls grew by 18%.
But all you can do is say "the food stamp rolls set a record so the economy is worse off."
Once again, you are stuck on stupid.
Go ahead and explain what Obama could have done differently. Still waiting for you to explain how Obama has fucked up. Go ahead and explain what could have been done differently and back up your claims using past policy decisions and the impact they have had on economic data.
Here are places to get economic data:
Labor department:
http://www.bls.gov/data/
http://www.bls.gov/webapps/legacy/cesbtab1.htm
Commerce Department:
http://www.bea.gov/itable/error_NIPA.cfm
St. Louis Fed:
http://research.stlouisfed.org/fred2/graph/
Annualized Growth Rate of Various Historical Economic Series
http://www.measuringworth.com/growth/
-
DEATH ROW JOE
- Signed to a Major Label Multi-Album Deal
- Posts: 20480
- Joined: Sat Sep 19, 2009 11:51 pm
Re: Food-Stamp Use Climbs to Record 46.7 MILLION...
So here is the latest ADP employment report. We can compare to the Jan 2009 report and see the economy has clearly improved. ADP (Automatic Data Processing) is a private company publicly traded on the NASDAQ, so no conspiracy theories about Obama "massaging" the numbers.
Now Drunk Kennedy and birtherplanet, go ahead and tell us that the economy has not improved under Obama.
===========================
August 2012 ADP National Employment Report®
http://www.adpemploymentreport.com/pdf/ ... ust_12.pdf
Employment in the U.S. nonfarm private business sector increased by 201,000 from July to August, on a seasonally adjusted basis. The estimated gain from June to July was revised up from the initial estimate of 163,000 to 173,000.
Employment in the private, service-providing sector expanded 185,000 in August, up from 156,000 in July. Employment in the private, goods-producing sector added 16,000 jobs in August. Manufacturing employment rose 3,000, following an increase of 6,000 in July.
Employment on large payrolls—those with 500 or more workers—increased 16,000 and employment on medium payrolls—those with 50 to 499 workers—rose 86,000 in August.
Employment on small payrolls—those with up to 49 workers—rose 99,000 that same period. Of the 86,000 jobs created on medium- sized payrolls, 12,000 jobs were created by the goodsproducing sector and 74,000 jobs were created by the service-providing sector.
Construction employment rose for the third consecutive month, adding 10,000 jobs, marking the best reading since March. The financial services sector added 8,000 jobs from July to August, marking the thirteenth consecutive monthly gain.
For more information, please visit the methodology section of the ADP National Employment
Report website at http://ADPemploymentreport.com/methodology.aspx.
===========================
Wednesday, February 4, 2009, 8:15 A.M. ET
http://www.adpemploymentreport.com/PDF/ ... ary_09.pdf
Nonfarm private employment decreased 522,000 from December 2008 to January 2009 on a seasonally adjusted basis, according to the ADP National Employment Report®. The estimated change of employment from November to December 2008 was revised up by 34,000, from a decline of 693,000 to a decline of 659,000.
January’s ADP Report estimates nonfarm private employment in the service-providing sector fell by 279,000. Employment in the goods-producing sector declined 243,000, the twenty-fourth consecutive monthly decline. Employment in the manufacturing sector declined 160,000, its twenty-eighth decline over the last twenty-nine months.
Large businesses, defined as those with 500 or more workers, saw employment decline 92,000, while medium-size businesses with between 50 and 499 workers declined 255,000. Employment among small-size businesses, defined as those with fewer than 50 workers, declined 175,000. Sharply falling employment at medium- and small-size businesses clearly indicates that the recession continues to spread well beyond manufacturing and housing-related activities.
In January, construction employment dropped 83,000. This was its twenty-second consecutive monthly decline, and brings the total decline in construction jobs since the peak in January 2007 to 923,000.
For information on the construction and use of the ADP Report, please visit the methodology section of the ADP National Employment Report website at http://ADPemploymentreport.com/methodology.aspx.
-
DEATH ROW JOE
- Signed to a Major Label Multi-Album Deal
- Posts: 20480
- Joined: Sat Sep 19, 2009 11:51 pm
Re: Food-Stamp Use Climbs to Record 46.7 MILLION...
DEATH ROW JOE wrote:Go ahead and explain what Obama could have done differently. Still waiting for you to explain how Obama has fucked up. Go ahead and explain what could have been done differently and back up your claims using past policy decisions and the impact they have had on the economy.brotherplanet wrote:Post all the graphs you want. Food stamp usage is at a record high. You're in denial because much like a Scientologist you don't
want to see how fucked up your leaders are.
Here are places to get economic data:
Labor department:
http://www.bls.gov/data/
http://www.bls.gov/webapps/legacy/cesbtab1.htm
Commerce Department:
http://www.bea.gov/itable/error_NIPA.cfm
St. Louis Fed:
http://research.stlouisfed.org/fred2/graph/
Annualized Growth Rate of Various Historical Economic Series
http://www.measuringworth.com/growth/


-
Skate4RnR

- Signed to a Major Label Multi-Album Deal
- Posts: 16520
- Joined: Mon Sep 20, 2004 12:42 pm
- Location: Kuruksetra
Re: Food-Stamp Use Climbs to Record 46.7 MILLION...
Obama should've had us back up to par in three years gawdamnit!