Recovery Measures
Posted: Sun Aug 05, 2012 3:58 pm
For all the idiots who continue to confuse damage caused by the Bush recession with lack of recovery from the Bush recession:
"All of these indicators collapsed in 2008 and early 2009, and only real GDP is back to the pre-recession peak. At the current pace of improvement, industrial production will be back to the pre-recession peak in early 2013, personal income less transfer payments late in 2013, and employment in late 2014."
"All of these indicators collapsed in 2008 and early 2009, and only real GDP is back to the pre-recession peak. At the current pace of improvement, industrial production will be back to the pre-recession peak in early 2013, personal income less transfer payments late in 2013, and employment in late 2014."
Recovery Measures
by Bill McBride on 8/05/2012 09:40:00 AM
http://www.calculatedriskblog.com/2012/ ... sures.html
Here is an update to four key indicators used by the NBER for business cycle dating: GDP, Employment, Industrial production and real personal income less transfer payments.
Note: The following graphs are all constructed as a percent of the peak in each indicator. This shows when the indicator has bottomed - and when the indicator has returned to the level of the previous peak. If the indicator is at a new peak, the value is 100%.
These graphs show that several major indicators are still significantly below the pre-recession peaks.
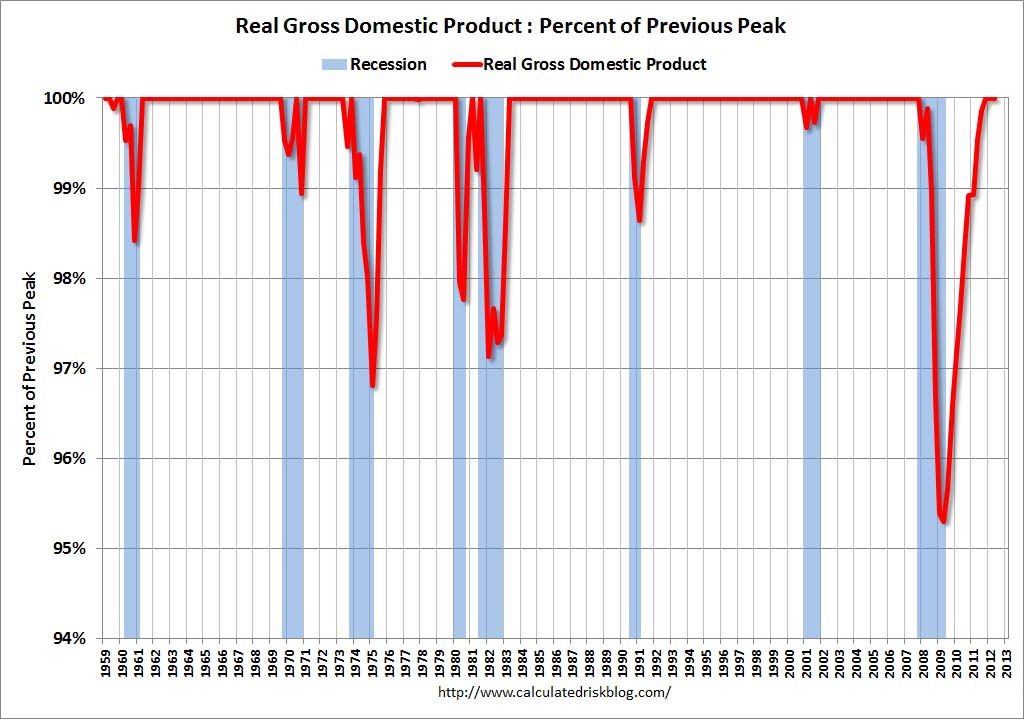
This graph is for real GDP through Q2 2012.
Real GDP returned to the pre-recession peak in Q4 2011, and has been at new post-recession highs for three consecutive quarters.
At the worst point - in Q2 2009 - real GDP was off 4.7% from the 2007 peak.
Personal Income less TransferReal GDP has performed better than other indicators ...
=============
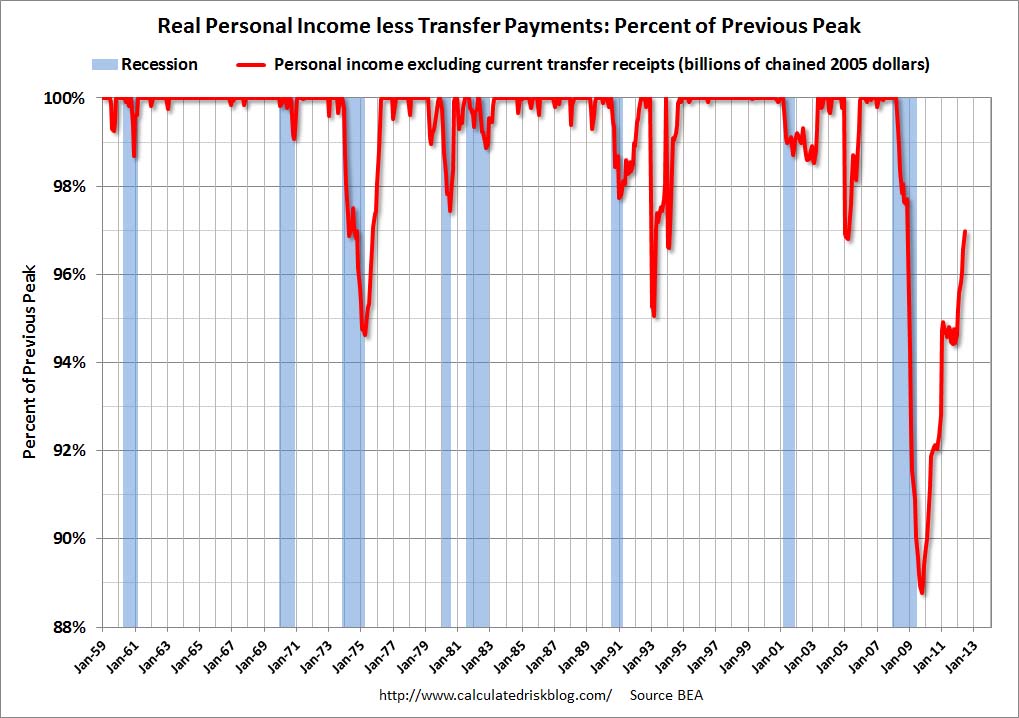
This graph shows real personal income less transfer payments as a percent of the previous peak through the June report.
This measure was off 11.2% at the trough in October 2009.
Real personal income less transfer payments are still 3.0% below the previous peak.
=============
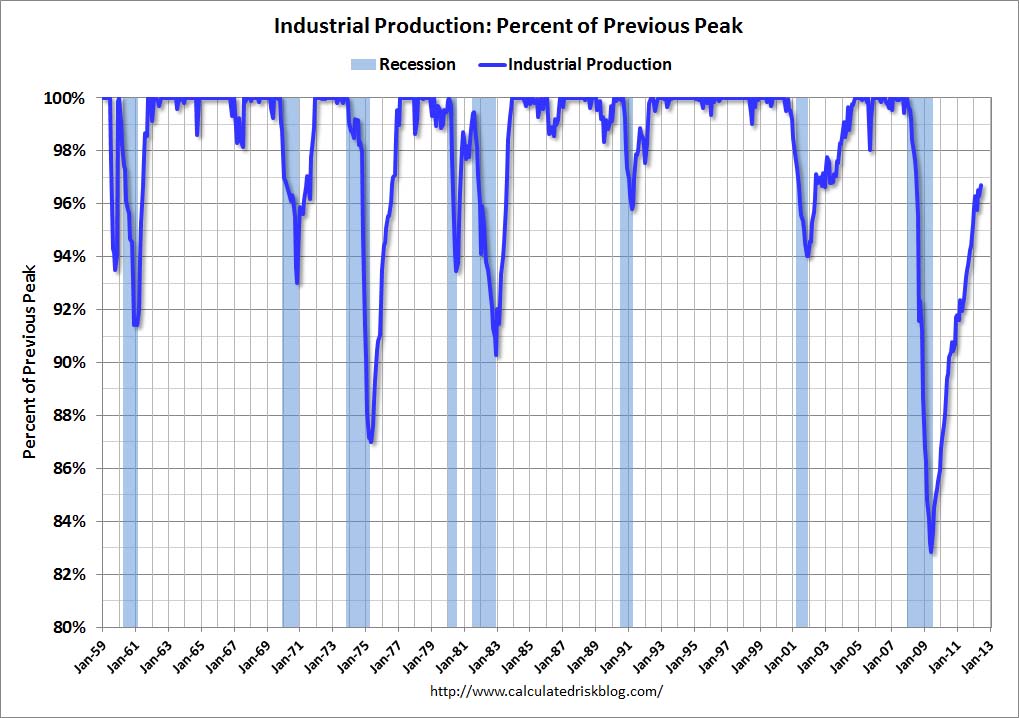
The third graph is for industrial production through June.
Industrial production was off over 17% at the trough in June 2009, and has been one of the stronger performing sectors during the recovery.
However industrial production is still 3.3% below the pre-recession peak.
=============
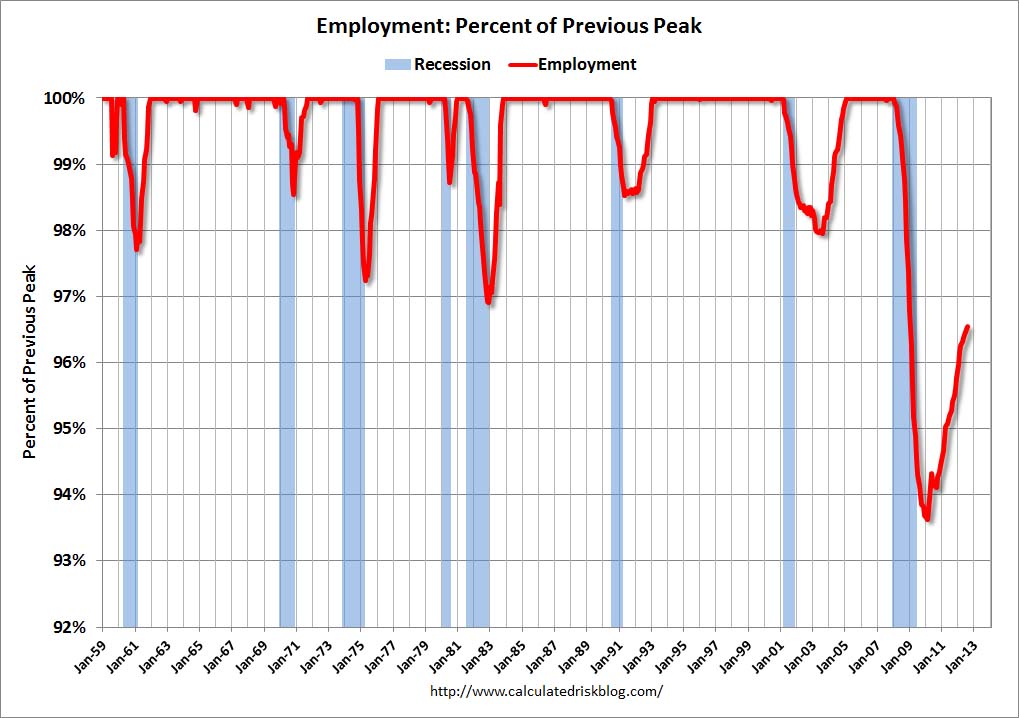
The final graph is for employment. This is similar to the graph I post every month comparing percent payroll jobs lost in several recessions.
Payroll employment is still 3.5% below the pre-recession peak.
All of these indicators collapsed in 2008 and early 2009, and only real GDP is back to the pre-recession peak. At the current pace of improvement, industrial production will be back to the pre-recession peak in early 2013, personal income less transfer payments late in 2013, and employment in late 2014.